Collecting BitAxe & NerdQAxe Telemetry in InfluxDB Using Telegraf Enrichment and an NGINX Proxy


BitAxe and NerdQAxe miners continuously produce a broad set of operational metrics. These include hash rate, temperature readings, voltage values, and other details that are extremely useful for monitoring device health and long-term behavior. The devices also have native support for writing these metrics into an InfluxDB v2-compatible endpoint, which is great in principle.
However, by default the miners do not include any static tag or identifier that tells InfluxDB which device a given measurement originates from. This leads to a practical problem:
- If you operate multiple miners, all metrics land in the same measurement series without differentiation.
- Alternatively, you’re forced to split the data across multiple buckets, which complicates queries and dashboards.
What we want instead is a setup where all miners can store their telemetry in one bucket, but with a reliable tag such as miner_id so dashboards and queries can distinguish each device cleanly.
To solve this, I use Telegraf as a “shim” between the miners and the real InfluxDB instance. Telegraf can receive writes through its influxdb_v2_listener input plugin and insert additional tags before forwarding the data to InfluxDB. Each miner gets its own listener on a dedicated port, making it possible to apply a unique miner_id.
The only complication: the miners also communicate with the InfluxDB REST API (e.g., during bootup and health checks), and Telegraf does not implement the full API surface. This is where an NGINX proxy becomes essential.
Below is the full pipeline and configuration.
Architecture Overview
The goal is to keep the miners completely unaware that Telegraf sits between them and the real InfluxDB server. They should continue sending telemetry and performing their startup API calls as usual.
The architecture looks like this:
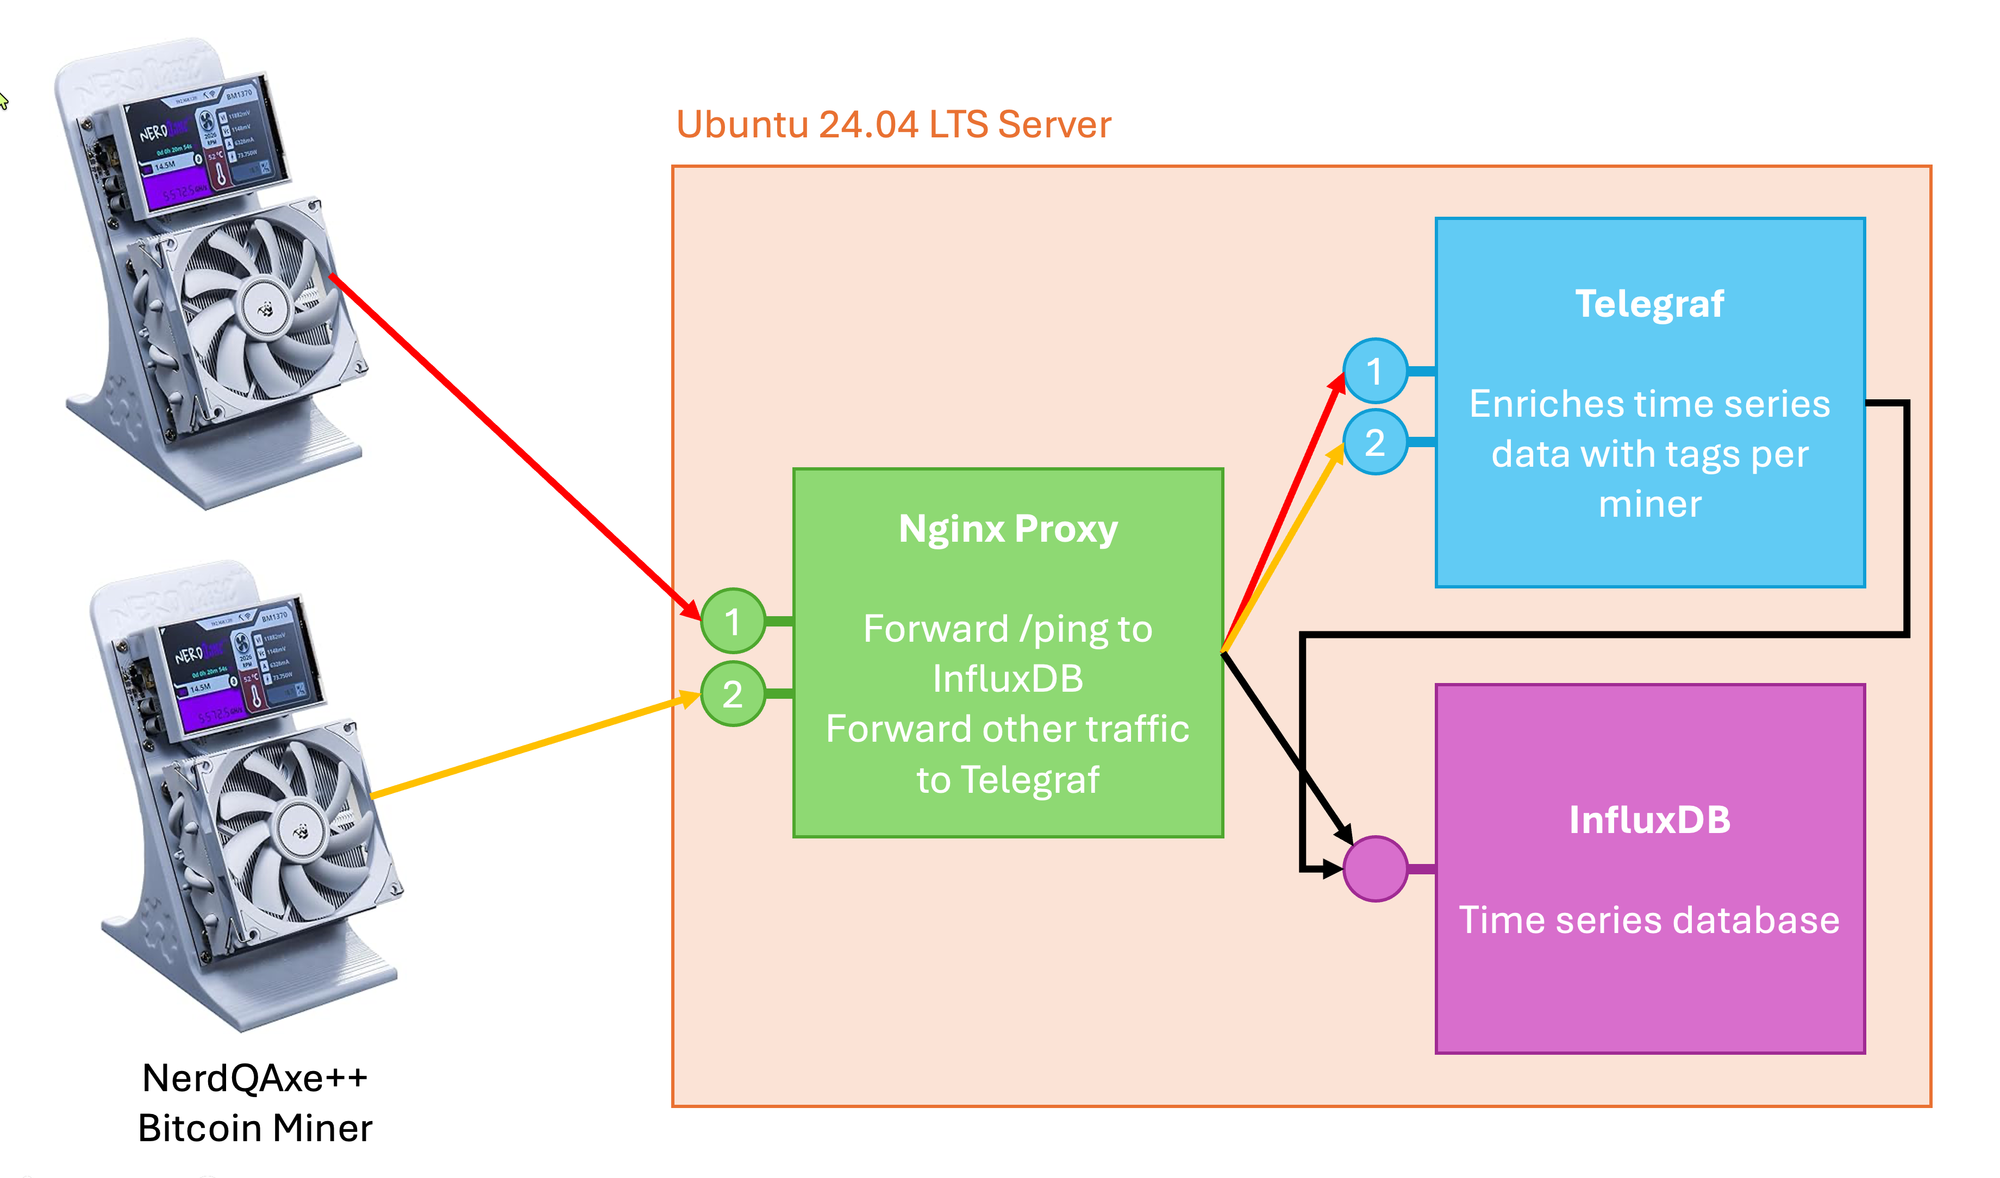
- NGINX listens on a port the miners connect to (e.g., 8090).
- Telemetry writes (
/api/v2/write) are forwarded to Telegraf listeners. - Everything else (e.g.,
/ping, org/bucket listings) is sent to the real InfluxDB. - Telegraf enriches telemetry with a static tag and forwards it to InfluxDB.
This maintains compatibility while adding the missing metadata.
Telegraf Configuration for Per-Miner Tagging
The following configuration defines:
- Global Telegraf agent settings
- A global tag
- Two
influxdb_v2_listenerinputs (one per miner) - One InfluxDB v2 output (the real database)
/etc/telegraf/telegraf.conf:
[agent]
  interval = "10s"
  debug = true
  quiet = false

[global_tags]
  miners = "nerdqaxe-miners"

# Accept writes from NerdQAxe 1 (pretending to be InfluxDB v2)
[[inputs.influxdb_v2_listener]]
  service_address = ":8087"
  token           = ""   # Configured to accept all traffic
  [inputs.influxdb_v2_listener.tags]
    miner_id = "nerdqaxe-1"

# Accept writes from NerdQAxe 2 (pretending to be InfluxDB v2)
[[inputs.influxdb_v2_listener]]
  service_address = ":8088"
  token           = ""   # Configured to accept all traffic
  [inputs.influxdb_v2_listener.tags]
    miner_id = "nerdqaxe-2"

# Forward to real InfluxDB v2.7.12
[[outputs.influxdb_v2]]
  urls         = ["http://quasar.local:8086"] # where the real InfluxDB listens
  token        = "xxxxxxxxxxxxxxxxxxxxxx" # InfluxDB write token
  organization = "bitcoin"
  bucket       = "mining"
Why per-miner listeners?
The influxdb_v2_listener plugin allows setting static tags on a per-listener basis or global tags. Since each listener runs on its own port, we can treat each port as a miner-specific entry point. Every metric submitted through that port automatically receives the correct miner_id.
This solves the missing device identification problem entirely, without touching the miners.
Handling the Miners’ REST API Calls
NerdQAxe and BitAxe devices do more than just write metrics. At startup they check whether the InfluxDB server is available and functional by calling endpoints such as:
/ping- Listing organizations
- Listing buckets/containers
- Other basic API calls
Telegraf’s listener only implements the write endpoint and rejects everything else, which causes miners to fail during initialization.
So we split traffic based on the request path:
/api/v2/write→ Telegraf- Everything else → Real InfluxDB
NGINX is ideal for this kind of conditional routing.
NGINX Configuration for a Smart Write Proxy
The proxy sits in front of both Telegraf and the actual InfluxDB instance.
/etc/nginx/sites-available/influxdb-proxy.conf:
server {
    listen 8090;
    server_name 192.168.0.6;

    # NerdQAxe health check -> InfluxDB UI/API
    location = /ping {
        proxy_pass http://quasar.local:8086; # real InfluxDB
    }

    # NerdQAxe-1 writes (InfluxDB v2 API) -> Telegraf
    location /api/v2/write {
        proxy_pass http://quasar.local:8087; # Telegraf influxdb_v2_listener
    }

    # NerdQAxe-2 writes (InfluxDB v2 API) -> Telegraf
    location /api/v2/write {
        proxy_pass http://quasar.local:8088; # Telegraf influxdb_v2_listener
    }

    # Anything else -> real InfluxDB UI/API
    location / {
        proxy_pass http://quasar.local:8086;
    }
}
What this proxy accomplishes
- The miners’
/pingcall succeeds, because it hits the real database. - Their metadata queries succeed as well.
- When the miners send telemetry through
/api/v2/write, NGINX forwards that request to the correct Telegraf listener depending on which port you use. - Telegraf tags and forwards the data into the real InfluxDB instance.
This gives the miners a fully functional InfluxDB environment while still allowing telemetry enrichment.
Final Result: A Clean, Unified Time Series Model
Once everything is running, all telemetry flows into one InfluxDB bucket (mining). The series now include:
- A global tag (
miners = "nerdqaxe-miners") - A device-specific
miner_idtag (nerdqaxe-1ornerdqaxe-2)
This allows queries like:
from(bucket: "mining")
  |> range(start: -1h)
  |> filter(fn: (r) => r.miner_id == "nerdqaxe-2")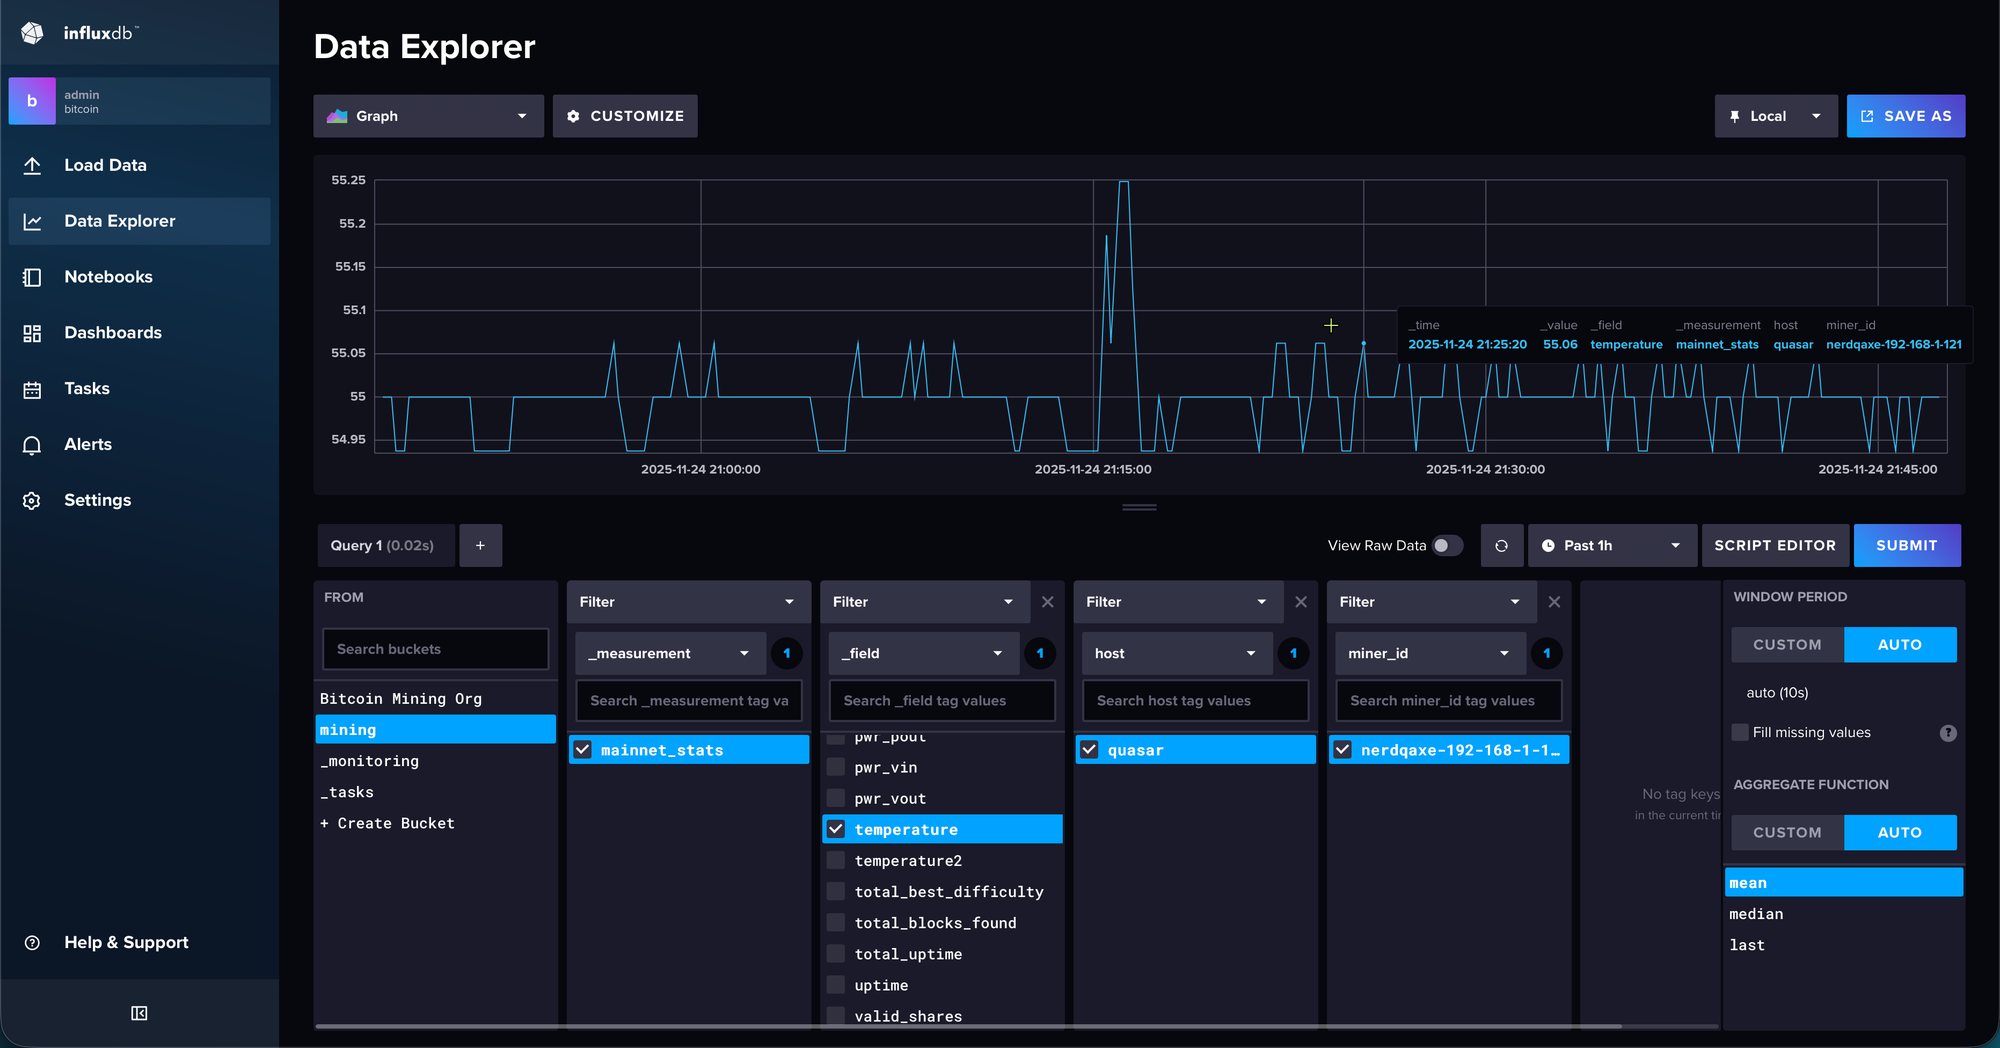
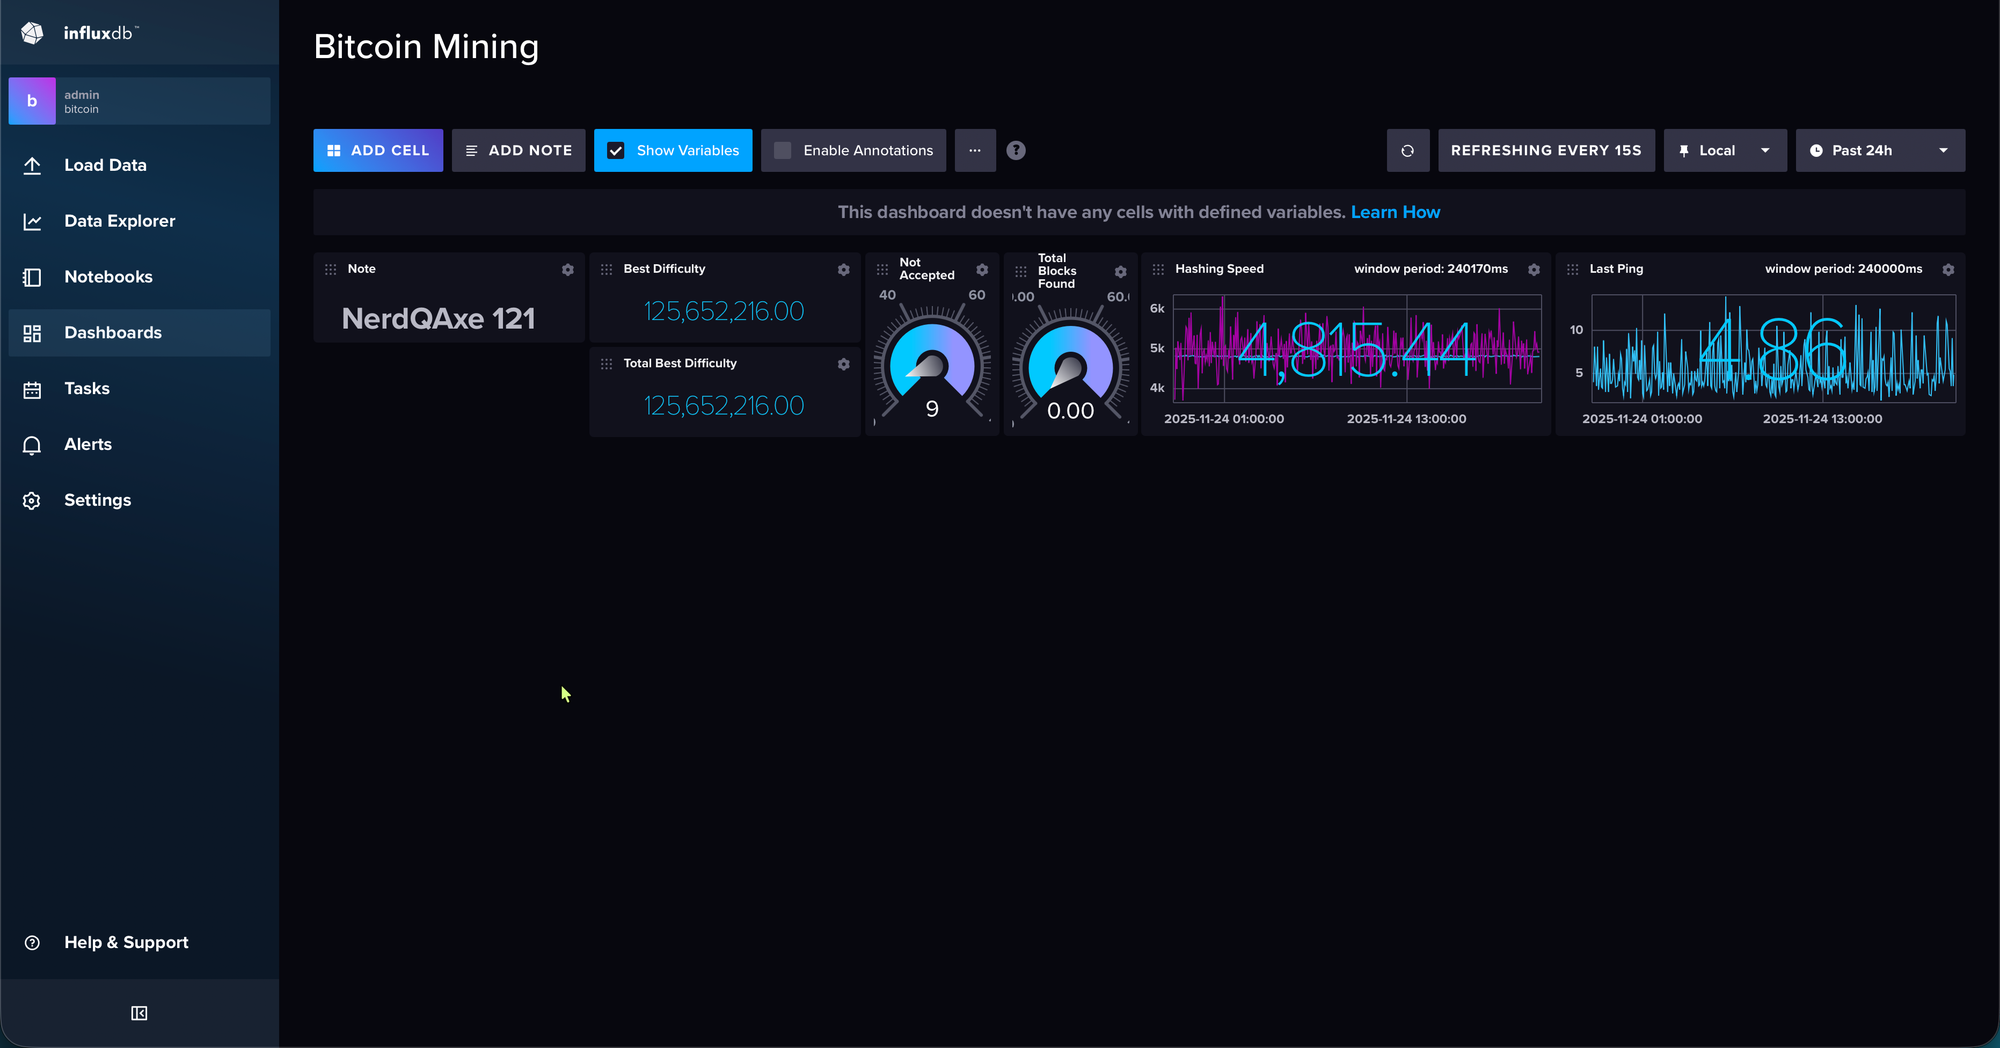
Dashboards can easily isolate or compare miners, and having all data in a single bucket avoids scattering your metrics across multiple retention paths or bucket configurations.
Summary
This setup resolves two limitations in the miners’ built-in InfluxDB support:
- Missing miner identification in telemetry
→ solved by Telegraf listeners, one per miner, each applying its own static tag - Incomplete InfluxDB API support in Telegraf
→ solved by an NGINX proxy that splits traffic between Telegraf and the real InfluxDB
The result is a robust and clean telemetry ingestion pipeline that keeps miner behavior consistent while giving you complete control over tagging and data organization.