
The 32 KB Ceiling

How adding tags to my metrics silently killed two bitcoin miners' telemetry reporting for nine days.
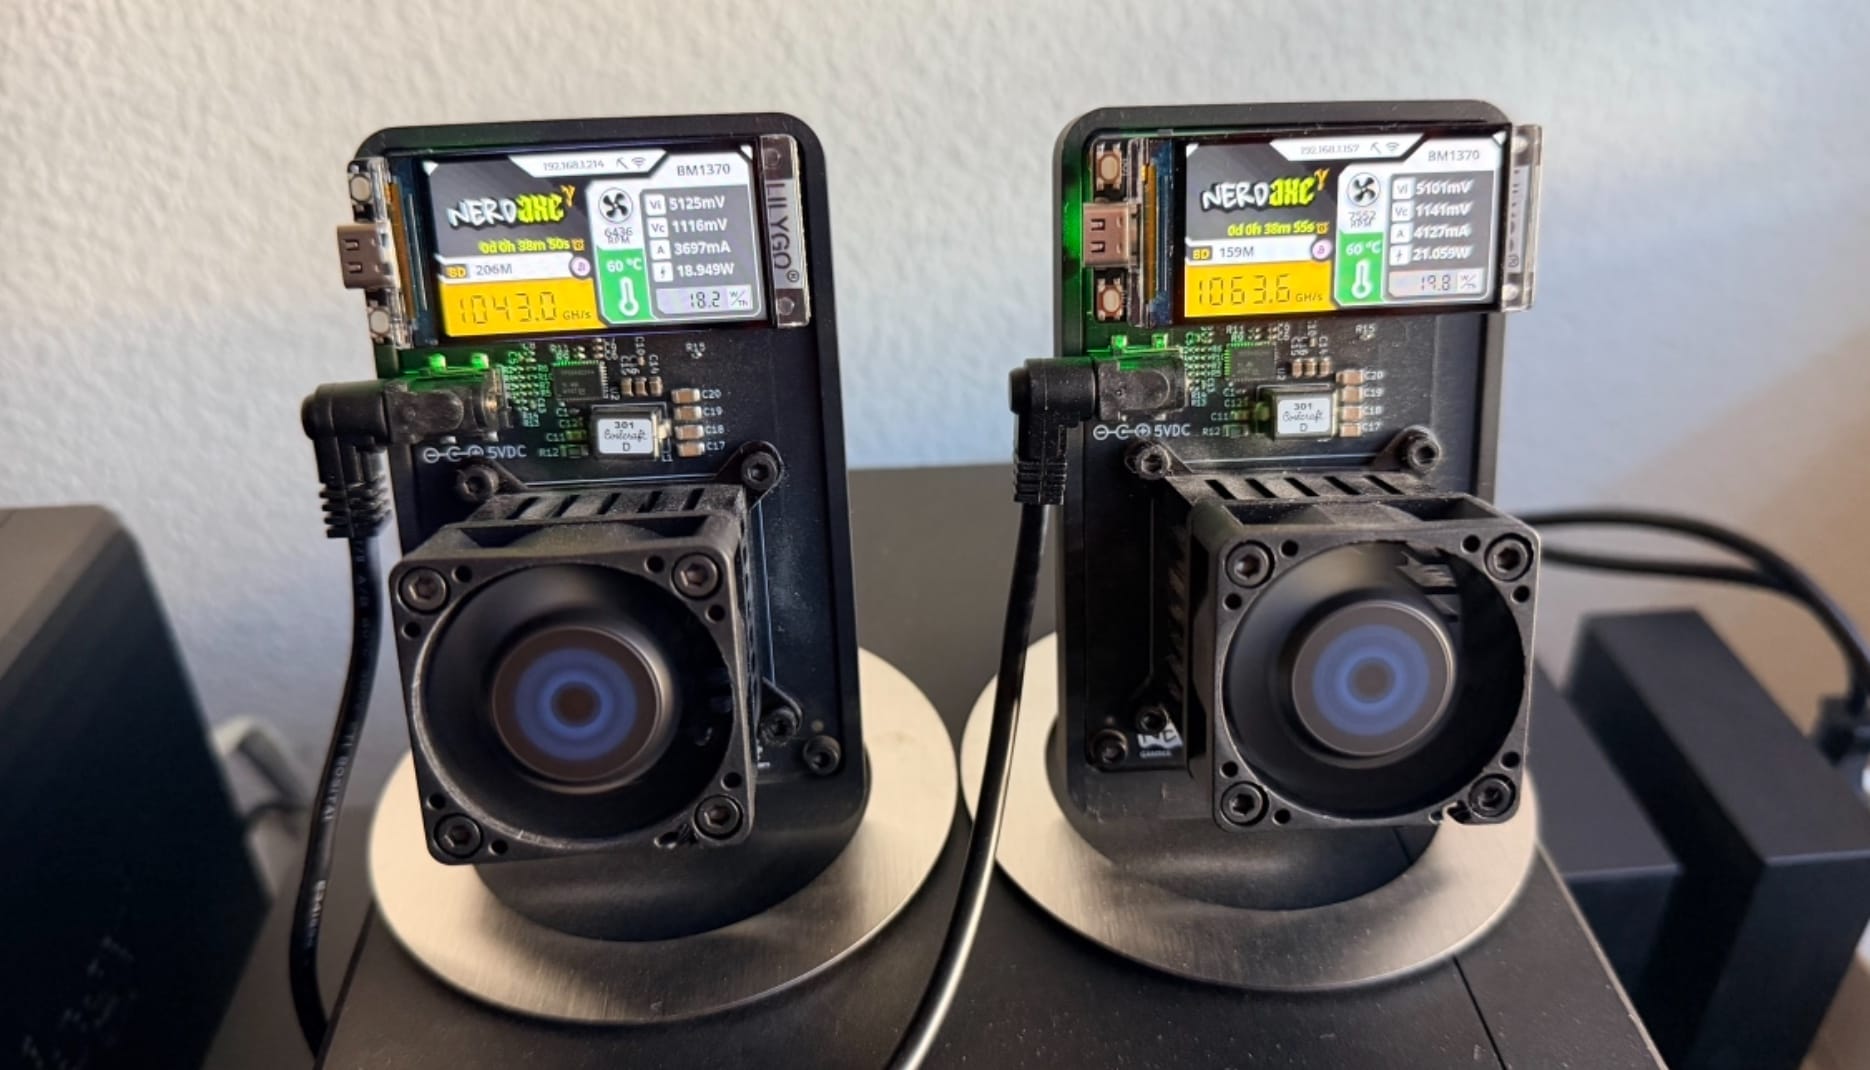
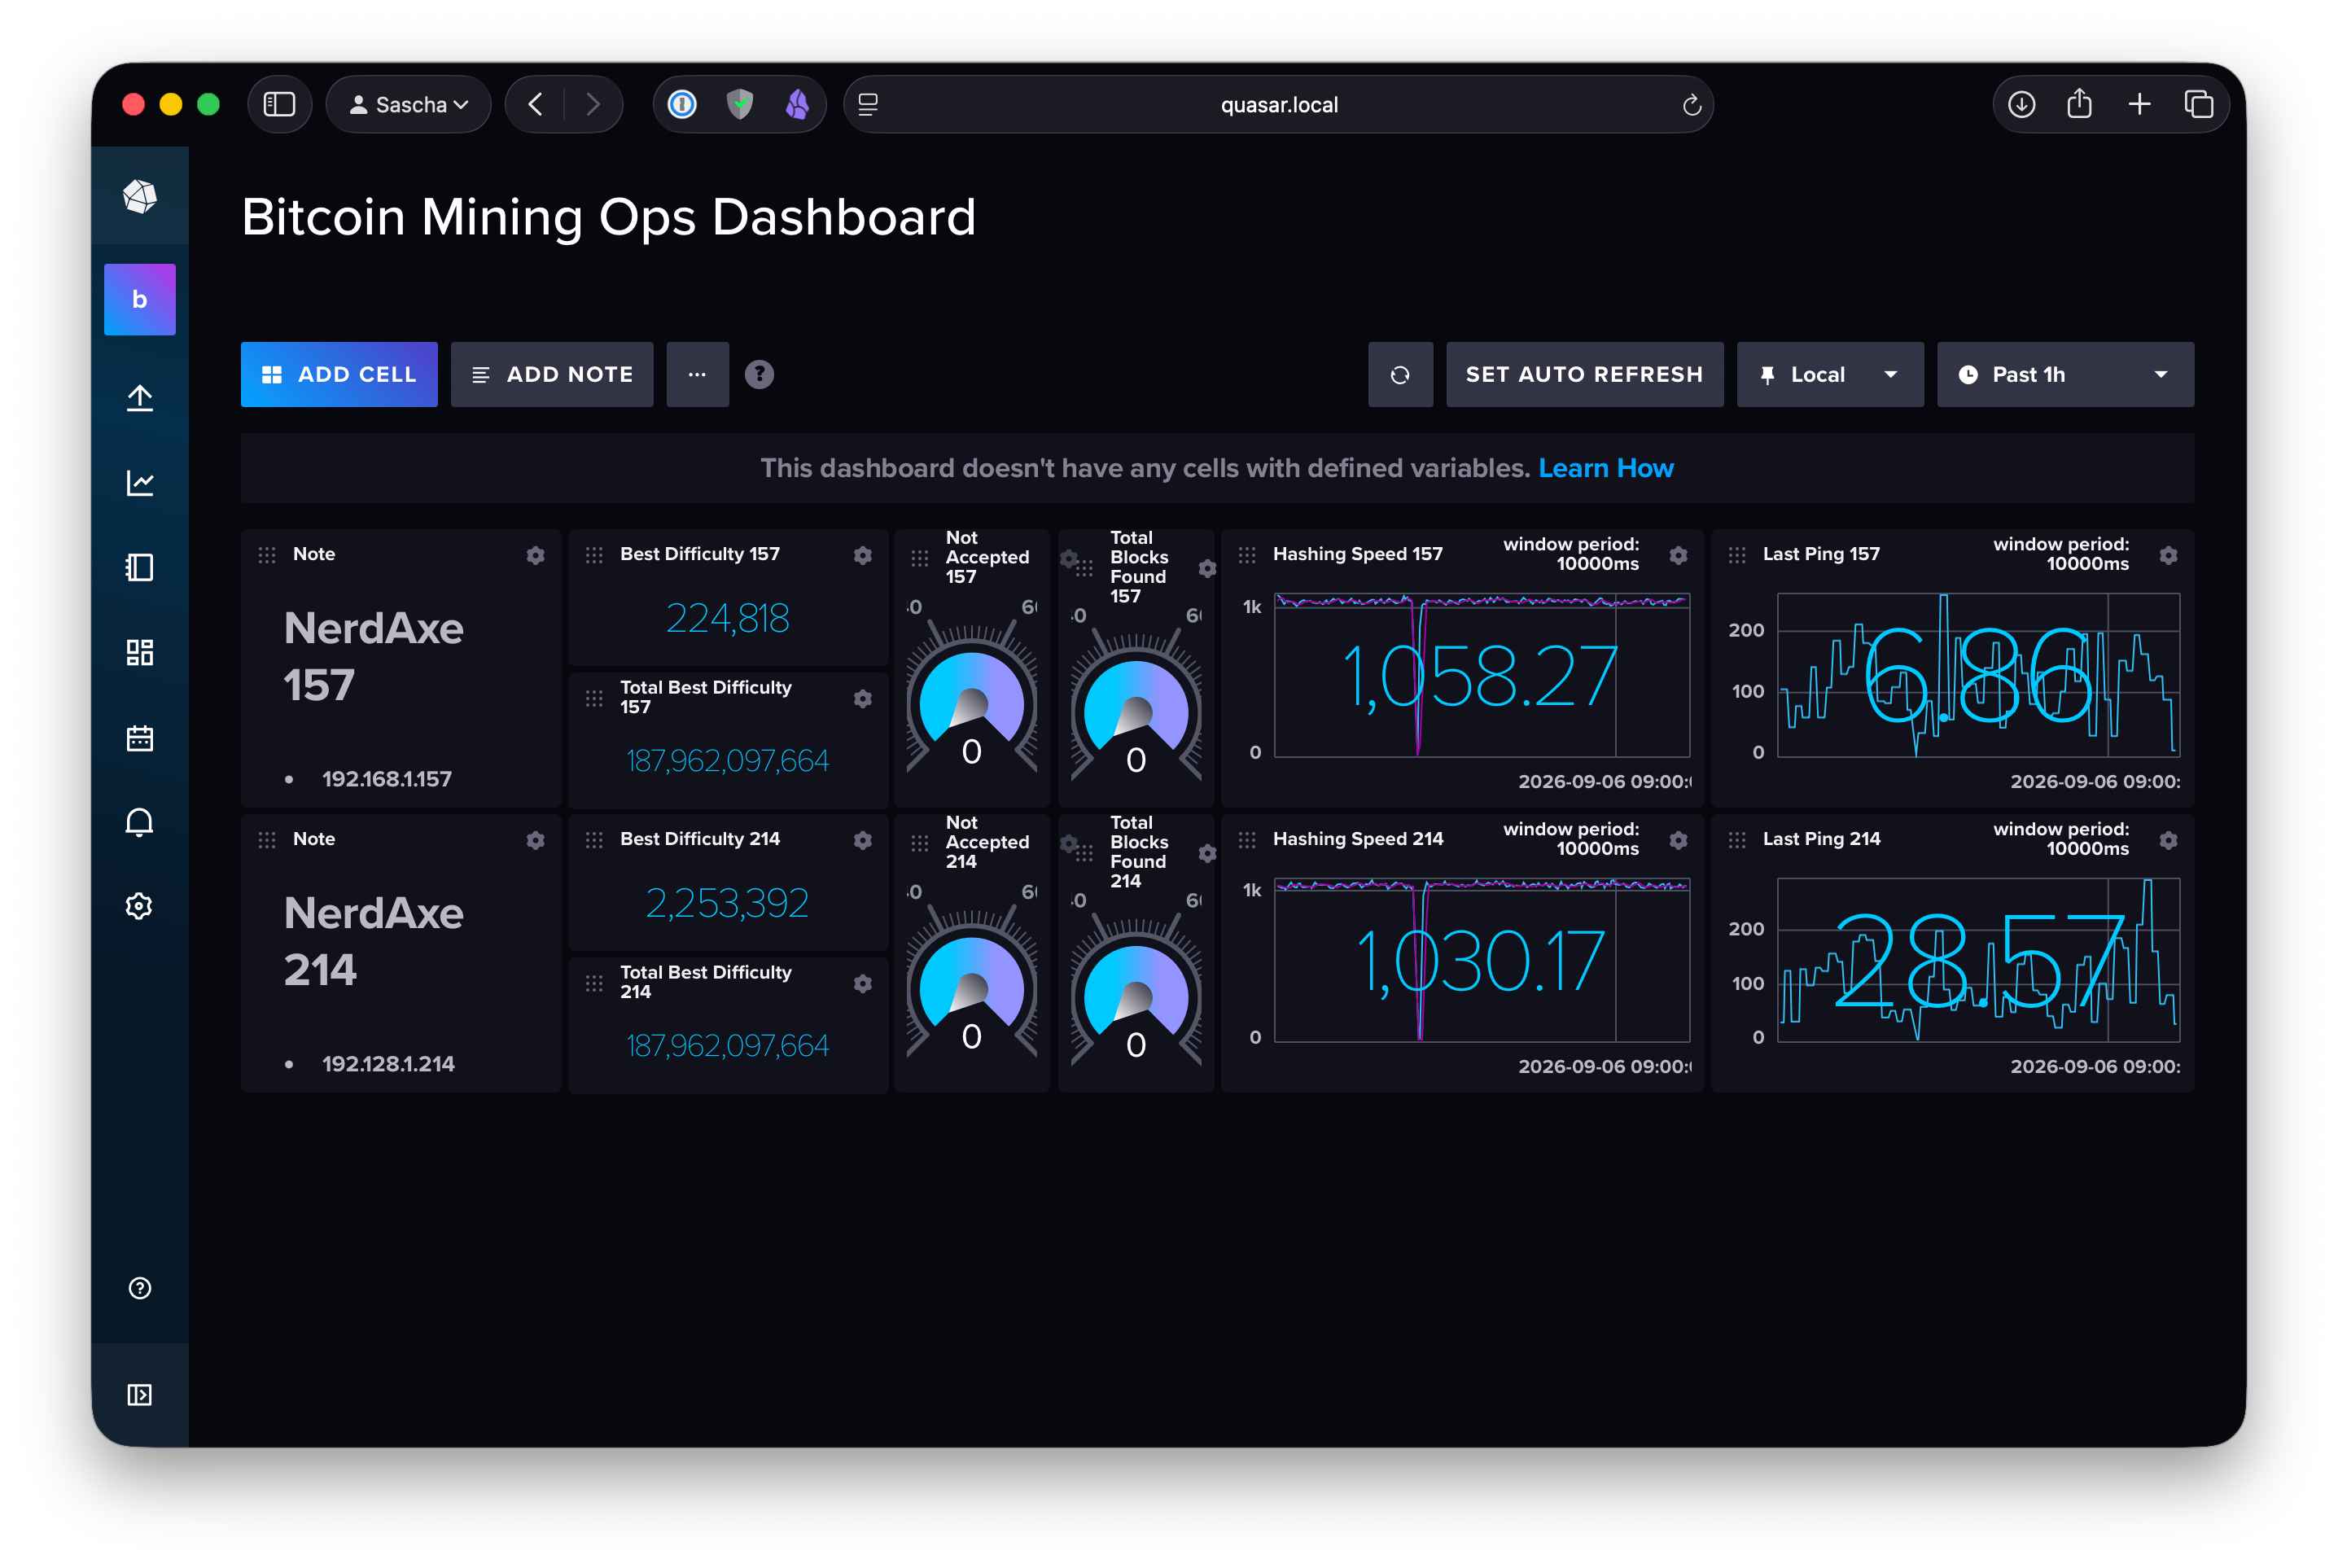
I run two NerdAxeGamma (BM1370) bitcoin miners that push telemetry into InfluxDB 2.
It worked fine for months. Then one morning the miners started logging this:
₿ (132501) InfluxDB: HTTP POST Status = 200, content_length = 0
E (132511) InfluxDB: Failed to parse _value
E (132511) influx_task: loading last values failed
Three lines, and every one of them points somewhere useful. Two of them point somewhere wrong.
The red herrings
HTTP POST Status = 200 looks like success, so the natural reading is "the server is fine, the client is confused." content_length = 0 looks like the server returned nothing, which suggests an empty result set or a broken query.
Both readings are wrong, and they're wrong in a way that costs you an hour if you trust them.
InfluxDB answers /api/v2/query with Transfer-Encoding: chunked. There is no Content-Length header at all, so ESP-IDF's esp_http_client_fetch_headers() returns 0. That zero is not information about the body — it's information about the framing. The body was, in fact, 34 kilobytes.
And the 200 was genuinely a 200. The server did its job perfectly. The bug was entirely on the client side, in code that had been running unchanged for months.
The topology
Here's what the setup actually looked like, which matters because the log line only makes sense once you know it:
  miner .157 ──▶ nginx :8091 ──┬── /api/v2/write ──▶ telegraf :8101 ──┐
                               └── everything else ─▶ InfluxDB :8086  │
                                                                      ├─▶ bucket "mining"                                                       │
  miner .214 ──▶ nginx :8092 ──┬── /api/v2/write ──▶ telegraf :8102 ──┘
                               └── everything else ─▶ InfluxDB :8086
The nginx layer exists because the miner firmware has exactly one host:port field.
The point of telegraf is to enrich the miner’s telemetry with the miner's name. Otherwise, all ingested data appears to be from the same miner.
It writes and queries against the same endpoint. But I wanted each miner's data tagged with which miner it came from, and the firmware doesn't emit tags. So nginx splits by path: writes go to a per-miner telegraf listener that stamps miner_id=nerdaxe-157 (or -214) onto every point, and everything else goes straight to InfluxDB.
That's a tidy solution. It's also the thing that broke everything, about ten minutes after I set it up.
Reading the firmware
The failing call is load_last_values(), which the miner runs at boot to restore its persistent counters — total uptime, all-time best difficulty, blocks found.
From components/influx/influx.cpp:
snprintf(query_json, sizeof(query_json),
  "{\"query\":\"from(bucket:\\\"%s\\\") |> range(start:-1y) "
  "|> filter(fn:(r) => r._measurement == \\\"%s\\\") |> last()\"}",
  m_bucket, m_prefix);
Note what isn't there: any filter on tags. It asks for last() across the entire measurement. In Flux, last() returns the final point of every series — and a series is one unique combination of measurement, field, and tag set.
The response lands here:
#define m_big_buffer_SIZE 32768
...
int data_read = esp_http_client_read_response(client, m_big_buffer,
                                              m_big_buffer_SIZE - 1);
A fixed 32 KB buffer, receiving a response whose size is a function of how many distinct tag sets have ever been written. Those two facts are on a collision course from the moment the code is written; it's only a question of when your cardinality crosses the line.
The parser then walks the CSV with strtok_r, skipping five columns to reach_value:
strtok_r(line, ",", &saveptr2); // result
strtok_r(NULL, ",", &saveptr2); // table
strtok_r(NULL, ",", &saveptr2); // _start
strtok_r(NULL, ",", &saveptr2); // _stop
strtok_r(NULL, ",", &saveptr2); // _time
token = strtok_r(NULL, ",", &saveptr2);
if (token == NULL) {
    ESP_LOGE(TAG, "Failed to parse _value");
    ...
}
Truncate the response mid-line and the final line has fewer than six fields.strtok_r returns NULL. That's the error message, verbatim.
The arithmetic
My mainnet_stats measurement had accumulated eight distinct tag sets: the two current miners, five older tag sets from when miners were labelled by IP address, and one untagged set from before nginx existed. Each miner writes 28 fields.
8 tag sets × 28 fields = 224 series
224 rows × ~152 bytes  = 34,153 bytes
Against a 32,768-byte buffer. Over by 1,385 bytes — about four percent.
I dumped the real response and ran it through a Python reimplementation of the firmware's parser. It fails at data line 216, on this fragment:
,_result,215,2025-09-06T00:07:13.944752757Z,202
A row cut clean in half. Four fields where the parser needs six.
The trigger was mundane and entirely self-inflicted: adding host and miner_id tags created two new tag sets, which added 56 new series, which added roughly 8 KB to a response that had about 6 KB of headroom. The untagged series in my database stops at 2026-08-21T12:40:40Z. The nginx symlinks are dated 12:23 the same day.
I broke it myself, at lunchtime, and didn't notice for a week.
Why it was intermittent, and why that's worse
Here's the part I find genuinely interesting.
load_last_values() sits in a retry loop, and the miner does not write anything until it succeeds:
while (1) {
    ...
    loaded_values_ok = loaded_values_ok || influxdb->load_last_values();
    if (!loaded_values_ok) {
        ESP_LOGE(TAG, "loading last values failed");
        break;
    }
    ...
    if (loaded_values_ok) break;
    vTaskDelay(pdMS_TO_TICKS(15000));
}
So a miner that can't parse the response is not a miner with a cosmetic log error. It's a miner that has silently stopped reporting. Both of mine wrote nothing at all from August 29th through September 5th — nine days of zero rows, which I only found by bucketing daily counts.
But the failure isn't perfectly deterministic, and the reason is delightful. The query uses range(start:-1y), so _start and _stop are computed fresh on every request — and they appear on every row. InfluxDB trims trailing zeros from the nanosecond field, so a timestamp is sometimes 30 characters and sometimes 29.
I measured it. Twenty identical queries against my (now smaller) 84-row dataset:
      5 11798
     15 11966
Two distinct lengths, 168 bytes apart. Eighty-four rows, two timestamps each — exactly one byte per timestamp occurrence. At the original 224 rows that's a swing of up to ~450 bytes in where the truncation lands.
So the cut point wanders. Usually it lands mid-row and the parse dies; occasionally it lands past the _field column and the whole thing "works." You get a system that fails hard, recovers for no visible reason, and fails again after the next reboot. That is a substantially worse failure mode than a clean, consistent break, because it destroys your ability to trust a successful test.
The bug hiding underneath
Once I understood the query, a second problem fell out of it. load_last_values() has no tag filter, and the parser overwrites its target fields on every matching row:
if (strcmp(field, "total_uptime") == 0)
    m_stats.total_uptime = (int) value;
else if (strcmp(field, "total_best_difficulty") == 0)
    m_stats.total_best_difficulty = value;
With multiple miners in one measurement, each miner restores whichever series happens to sort last — not necessarily its own. My two miners were both reporting an identical all-time best difficulty of 187,962,097,664, because they had been overwriting each other's records for weeks. Nobody would ever notice this from a dashboard. It just quietly makes the number meaningless.
The fix
The firmware sends a query I can't change. But every request already passes through nginx, and nginx can rewrite a request body. So I scoped the query per miner at the proxy:
location = /api/v2/query {
    proxy_set_header Content-Type "application/vnd.flux";
    proxy_set_body 'from(bucket:"mining") |> range(start:-1y) |> filter(fn:(r) => r._measurement == "mainnet_stats" and r.miner_id == "nerdaxe-157") |> last()
';
    proxy_pass http://quasar.local:8086;
}
Switching to application/vnd.flux sends raw Flux instead of JSON-wrapped Flux, which avoids three levels of quote escaping. nginx recalculates Content-Length for you.
Response size: 34,153 → 4,196 bytes. And each miner now restores its own counters instead of a stranger's.
I also deleted the five stale IP-named tag sets — 46.8 million points, which dropped the InfluxDB engine directory from 88 MB to 7.9 MB and brought even the unfiltered query down to 11,953 bytes. That alone would have fixed the symptom.
It's the wrong fix on its own, though: cardinality only ever grows, so it buys time rather than correctness, and it does nothing about the cross-contaminated counters.
A Flux trap worth knowing
One self-inflicted detour. Early on I checked when data had stopped with:
|> group(columns:["miner_id"]) |> sort(columns:["_time"]) |> last()
and concluded, confidently and wrongly, that writes had stopped on August 27th. last() returns the last row in table order, not the newest by timestamp. Once you group() several series into one table, row order is series-major, so you get the last series' final point rather than the global maximum. Use max(column:"_time"), or don't regroup. I built a chunk of a theory on that bad reading before the numbers stopped adding up.
What I'd take away
A fixed buffer against an unbounded result set is a bug with a timer on it.
Nothing in that firmware is wrong at 100 series. Everything is wrong at 224. No code changed; the data grew.
Cardinality is a load-bearing property.
I thought I was adding metadata. I was adding series, and series were the scarce resource. The blast radius of a tag is larger than it looks.
Query only what you need.last() across an entire measurement to recover three scalars is asking for every series to pay for three fields. A tag filter would have made this bug unreachable, and would have prevented the counter mixing too.
A 200 is not a success.
Neither is a metric that's still arriving — one of my miners was reporting cheerfully while its all-time record came from a different machine.
Test intermittency, not just failure.
The nine-day outage was easy to see once I looked. The 20% recovery rate is what would have made me trust a fix that hadn't actually fixed anything.
Environment: InfluxDB 2.9.1, Telegraf 1.39.3, nginx 1.24.0, NerdAxeGamma (BM1370) firmware v1.1.0. The 32 KB buffer and the unfiltered query are byte-identical between the v1.1.0 tag my miners run and the repository's current master branch — so this is not something a firmware update has quietly fixed.