Measuring LLM Inference: A Practical Look at token-sec-calc I published on GitHub.


When you self-host an LLM — vLLM, SGLang, TGI, llama.cpp server — or wire your app to a hosted gateway, one question dominates every capacity decision: how many tokens per second can this thing actually deliver?
That number is harder to pin down than it sounds. Output length varies because of EOS. Prompt length varies because real prompts vary. Streaming adds time-to-first-token. Concurrency changes everything. And the moment you put it under a sustained request rate, queueing shows up.
token-sec-calc is a small Python CLI that focuses on exactly this problem: producing the throughput, latency, TTFT, and queue-wait numbers you actually need to size a model deployment — against any OpenAI-compatible endpoint, with no SDK lock-in.
The repo is available at: https://github.com/TechPreacher/token-sec-calc
This post walks through what it does, how to use it, where it shines, and what is still missing.
What it is
A single console command — benchmark — that hits /v1/completions or /v1/chat/completions and reports:
- Aggregate throughput in tokens/sec across the entire run.
- Per-request latency percentiles — p50, p90, p95, p99.
- Time-to-first-token (TTFT) under SSE streaming.
- Dispatcher queue wait under a sustained Poisson arrival rate.
- Side-by-side comparisons across multiple endpoints or models in one invocation.
It is intentionally not an SDK. The transport is plain requests over HTTPS, the streaming branch is a hand-rolled SSE consumer, and the only mandatory third-party dependency at runtime is python-dotenv. tiktoken is an optional extra for accurate token counts.
The project lives at https://github.com/TechPreacher/token-sec-calc and is MIT-licensed.
Installing
Python ≥ 3.11. The project uses uv for dependency and environment management.
git clone https://github.com/TechPreacher/token-sec-calc.git
cd token-sec-calc
uv sync                       # runtime deps + editable install
uv sync --group dev           # add pytest + pyyaml + ruff for the test suite
uv sync --extra tiktoken      # optional: accurate tokenization
After sync, both forms work:
uv run benchmark --help
uv run python -m benchmark --help
A .env file is the easiest way to configure the common case:
cp .env.example .env
$EDITOR .env       # set ENDPOINT, API_KEY, MODEL
uv run benchmark
CLI flags always win over .env, so you can keep a sane default and override per run.
The two run modes
Closed-loop (default)
N concurrent requests fire in parallel; the slowest completion ends the trial; the next trial starts. Throughput is total_tokens / total_wall_time.
uv run benchmark --concurrent 8 --trials 10 --max_tokens 256
Use this when you want to characterize steady-state batched serving at a known concurrency level. It is the right model for "we want to run 8 concurrent generations and we want to know what the server does."
Open-loop Poisson QPS
Set --qps and --duration and the runner switches to a pre-scheduled Poisson arrival pattern. Requests are submitted to a shared worker pool at their scheduled times; if the pool is saturated, requests queue inside the executor and that queueing is surfaced as queue_wait_s per request, plus a Dispatcher queue wait row in the summary.
uv run benchmark --qps 25 --duration 60 --max_tokens 128
This is the mode that answers the question that closed-loop cannot: what happens to my serving stack at a target request rate, including head-of-line blocking and saturation?
The achieved request rate is reported alongside the target so you immediately see if the server fell behind.
Streaming + TTFT
uv run benchmark --stream true --concurrent 4 --trials 5
With streaming on, the SSE consumer captures the wall-clock time of the first content delta per request. A Time-to-first-token percentile block appears in the summary and a ttft_s column appears in the per-request log. Combine with --qps for serving-style benchmarks where TTFT is the SLO that actually matters.
Removing the most common sources of noise
Two features deserve special attention because they are the difference between a benchmark you trust and a benchmark you don't.
Pinned output length. Tokens per second is meaningless if every request stops at a different output length because of EOS. With --ignore_eos true (default), the runner sends both ignore_eos: true and min_tokens: max_tokens (vLLM/SGLang extensions). Every request emits exactly max_tokens. The aggregate throughput number becomes load-comparable across prompts. Strict hosted gateways may reject those fields — set --ignore_eos false for OpenAI, Together, Anthropic-shaped endpoints, etc.
Pinned input length. Prompt length variance biases output throughput because longer prompts take longer to prefill. --prompt_tokens 256 pads or truncates every prompt to exactly 256 tokens, as counted by the active tokenizer, before sending. The normalization uses a binary search on character length to land on the target token count.
uv run benchmark --prompt_tokens 256 --max_tokens 256
With both pinned, output throughput is comparable across runs, models, and backends in a way that ad-hoc benchmarks rarely manage.
Multi-endpoint comparison
Pass comma-separated values to --endpoint, --model, and/or --api_key. Singleton lists are broadcast; non-singleton lists must share the same length.
uv run benchmark \
  --endpoint http://a:8000/v1/completions,http://b:8000/v1/completions \
  --model llama-8b,mistral-7b \
  --api_key EMPTY \
  --concurrent 4 --trials 3
Each config runs sequentially with the same flags and a comparison table is printed at the end:
=================================================================
Comparison
=================================================================
#  model       endpoint                          req  fail  tok/s   p50_lat  p95_lat  p99_lat  mean_pT
-  ----------  --------------------------------  ---  ----  ------  -------  -------  -------  -------
1  llama-8b    http://a:8000/v1/completions       12     0  158.42    0.821    1.118    1.144       12
2  mistral-7b  http://b:8000/v1/completions       12     0  142.07    0.913    1.241    1.288       12
When --output runs.jsonl is set in matrix mode, per-config logs are auto-suffixed: runs.0.jsonl, runs.1.jsonl, ... TTFT and achv_qps columns appear automatically when those values are populated.
Per-request logging
--output runs.jsonl writes one JSON object per non-warmup request:
{
  "trial": 1,
  "request_index": 0,
  "prompt_chars": 47,
  "prompt_tokens": 12,
  "output_tokens": 128,
  "latency_s": 0.821,
  "ttft_s": null,
  "scheduled_offset_s": null,
  "queue_wait_s": null,
  "ok": true,
  "estimated": false,
  "error": ""
}
.csv extension writes the same schema with a header row. Field semantics:
output_tokens— server-reportedusage.completion_tokenswhen present; otherwise estimated from text length, withestimated: trueflagged on that row.ttft_s— populated only under streaming successes.scheduled_offset_s/queue_wait_s— populated only under open-loop QPS.error— empty string on success.
Warmup requests are intentionally excluded so that startup latency does not leak into the dataset.
Tokenizer choices
The active tokenizer is used both for per-request prompt-token counts and as the fallback when the server omits usage.completion_tokens. The server's reported count always wins when present.
--tokenizer auto(default) —tiktoken:cl100k_baseif installed, otherwisechars/4with a one-time stderr notice.--tokenizer chars4—len(text) // 4. Fast, ASCII-biased, dependency-free.--tokenizer tiktoken:<encoding>— explicit, e.g.tiktoken:o200k_basefor GPT-4o-family encodings.
Install tiktoken with uv sync --extra tiktoken.
Prompt control
By default each request draws a random prompt from a built-in pool of 100 prompts spanning explanation, code, creative writing, and science.
--prompt "..."— fixed prompt for every request.--questions_file path.json— your own JSON array of strings.--questions_file ""— disable the pool entirely; falls back to a single built-in default.--seed 42— reproducible random picks and Poisson schedule.
The seed flag is a small but important detail: in open-loop mode it pins both the prompt picks and the Poisson inter-arrival times, so a run can be reproduced byte-for-byte on the dispatch side.
What is great about it
A few things stand out after using it on a real serving stack:
Zero ceremony. A single uv run benchmark command with three env vars (ENDPOINT, API_KEY, MODEL) produces a useful number. There is no separate config file format, no orchestrator, no daemon.
The right invariants by default. Pinned output length, pinned input length, no retries, warmup excluded from the log, seedable randomness. These are the small choices that turn "a benchmark" into "a benchmark whose numbers you can defend."
Open-loop is a first-class citizen. Many homemade benchmarks only do closed-loop concurrency, which can quietly miss tail-latency blowups under sustained load. Having --qps with explicit queue_wait_s per request is the feature that surfaces saturation behavior most cleanly.
Matrix mode is genuinely useful. Comma-separated lists with broadcast semantics let you compare a vLLM build vs an SGLang build, or an 8B vs a 70B, or two model revisions, in one invocation with one log file per config.
Clean architecture. The package is split by concern: client does HTTP, runner does dispatch, stats does math, records does I/O, cli does argparse. The dependency graph is acyclic. The test suite (~130 tests, fully mocked, no network) covers each module individually and lints with ruff. CI runs both on every push and pull request.
No SDK lock-in. Just requests. That means any OpenAI-compatible server works without an adapter, and the tool itself is trivially auditable — there is no vendor SDK to mask what is on the wire.
What is still missing
The tool is small and focused, which is a feature. But the limitations are real and worth being explicit about.
No retries, no backoff. A 5xx or network error counts as a failed request and degrades the throughput number. That is intentional — masking errors with retries inside a benchmark is a category error — but it also means the tool will not tell you "the endpoint is flaky." A separate observability layer is required to spot intermittent failure.
No prefill vs decode breakdown. Aggregate tok/s blends prefill (input tokens processed) and decode (output tokens generated). Modern serving stacks behave very differently in those two phases (prefill is compute-bound, decode is memory-bound), and the gold-standard metric for decode throughput is output_tokens / (latency - ttft). The data to compute that is captured in the per-request log under streaming, but the summary does not yet print decode-only tok/s as its own line.
No multi-host orchestration. Matrix mode is sequential — one config at a time from one machine. Distributed load generation across N driver hosts to actually saturate a large serving cluster is out of scope, and any benchmark that bottlenecks on the driver will under-report server capacity.
No HTTP/2 or connection pooling tuning. Each request goes through the default requests session. For very high QPS or low-RTT setups, connection management can become a non-trivial slice of measured latency.
No native asyncio path. Concurrency uses a thread pool. That is fine up to ~hundreds of concurrent inflight requests, but a pure-async client over httpx or aiohttp would scale further with less memory and tighter scheduling.
No built-in plotting or HTML report. The output is a terminal summary plus JSONL/CSV. Downstream analysis in pandas/matplotlib/DuckDB is straightforward but not bundled.
Limited cancellation semantics. Ctrl-C exits with 130, but mid-flight requests inside the thread pool may continue to consume server capacity briefly. A cooperative cancellation path with deadline propagation would be cleaner.
No fancy traffic shapes. Poisson is the only open-loop arrival model. Real production traffic includes diurnal patterns, burstiness, and step functions. A ramp profile (--ramp 0:60s,10:120s,50:60s) would be a small, valuable addition.
No GPU-side metrics correlation. The tool sees only what the HTTP layer reports. Pairing latency percentiles with nvidia-smi/DCGM data, KV-cache occupancy, or vLLM's internal stats endpoint would close the loop between "the client saw 158 tok/s" and "here is why."
A real run: Nemotron 3 Super 120B on a 2-node DGX Spark cluster
To make this concrete, here is the tool run against a 2-node NVIDIA DGX Spark cluster serving nvidia/nemotron-3-super (120B parameters), 64 concurrent requests × 5 trials, fixed 11-token prompt, 128 output tokens per request pinned with ignore_eos:
Benchmarking https://xxx.corti.com/v1/chat/completions
API: chat/completions (mode=auto)
Model: nvidia/nemotron-3-super
Mode: closed-loop (64 concurrent × 5 trials)
Warmup: 1 request(s)
Max tokens per request: 128 (ignore_eos + min_tokens pinned)
Sampling: temperature=1.0 top_p=1.0
Streaming: off
Tokenizer: tiktoken:cl100k_base
Prompt source: fixed prompt (49 chars)
------------------------------------------------------------
Running 1 warmup request(s)...
  Warmup: 128 tokens in 7.04s (18.17 tok/s)

Trial  1:  8192 tokens | 26.43s |  309.92 tok/s
Trial  2:  8192 tokens | 25.98s |  315.34 tok/s
Trial  3:  8192 tokens | 25.68s |  319.05 tok/s
Trial  4:  8192 tokens | 25.88s |  316.57 tok/s
Trial  5:  8192 tokens | 26.10s |  313.86 tok/s
------------------------------------------------------------
Results over 5 trials (320 requests):
  Aggregate throughput:  314.92 tok/s   (total_tokens / total_wall_time)
  Mean of per-trial:     314.95 tok/s
  Min / Max per-trial:   309.92 /  319.05 tok/s
  Total tokens:         40960
  Total wall time:      130.07s
  Prompt input tokens:  min=   11  mean=  11.0  max=   11  p50=11  p99=11
  Per-request latency (s) over 320 successes:
    p50=25.874  p90=26.145  p95=26.335  p99=26.401
  Per-request latency / token (s):
    p50=0.2021  p90=0.2043  p95=0.2057  p99=0.2063
What these numbers actually say:
Single-stream peak is the warmup line. The warmup request — one in flight, no batching pressure — generated 128 tokens in 7.04 seconds, or 18.17 tok/s. That is the closest thing this run produced to a "decode tok/s on a single stream" number for a 120B model on this hardware. Cold-cache effects mean the true single-stream peak is likely slightly higher with a couple more warmup requests, but the order of magnitude is right: ~18-20 tok/s of decode throughput for one user.
Aggregate throughput scales nearly linearly with batching. Under 64 concurrent requests, the cluster delivered 314.92 tok/s aggregate. Per-stream that works out to 314.92 / 64 ≈ 4.92 tok/s per concurrent stream, which matches the latency_per_token row almost exactly (p50 = 0.2021 s/tok → 1 / 0.2021 ≈ 4.95 tok/s). Going from 1 stream at 18 tok/s to 64 streams at 5 tok/s each yields a 64 × 5 / 18 ≈ 17.5× aggregate gain — solid batching efficiency, with the expected per-stream slowdown as the decoder is shared.
The tail is extremely tight. p50 = 25.87s, p99 = 26.40s — about a 2% spread from median to p99 over 320 requests. That is what well-behaved batching with no head-of-line blocking looks like: every request sits in the same fixed-size batch and finishes at roughly the same time. If the runtime had been struggling — KV-cache thrashing, fragmented batches, scheduler stalls — that spread would be much wider.
Per-request latency is dominated by output length, not prefill. The prompt is 11 tokens (negligible prefill on a model this size); the output is pinned at 128 tokens. With p50 latency = 25.87s for 128 tokens, decode is essentially the entire wall clock. That makes the latency_per_token row a clean decode-speed proxy for this run.
Practical interpretation for serving 120B locally. This cluster can comfortably hold ~64 concurrent users at roughly 5 tok/s each — slightly below comfortable human reading speed but usable for non-streaming UX or background generation. A single interactive user (streaming chat) would see closer to 18 tok/s, which is comfortable for reading as the tokens arrive. The crossover where added concurrency stops being worth the per-stream slowdown is somewhere below 64 — a --qps sweep with --stream true and TTFT capture would pin down exactly where TTFT and decode speed start violating the target SLO.
What this run does not tell you. It uses a fixed 11-token prompt, so prefill cost is essentially zero — production prompts of 500-2000 tokens would shift the picture and pull TTFT up significantly. It is closed-loop, so it does not reveal saturation behavior under bursty arrivals. And it is non-streaming, so there is no TTFT number. Each of those is one extra flag away.
GPU utilization during the run
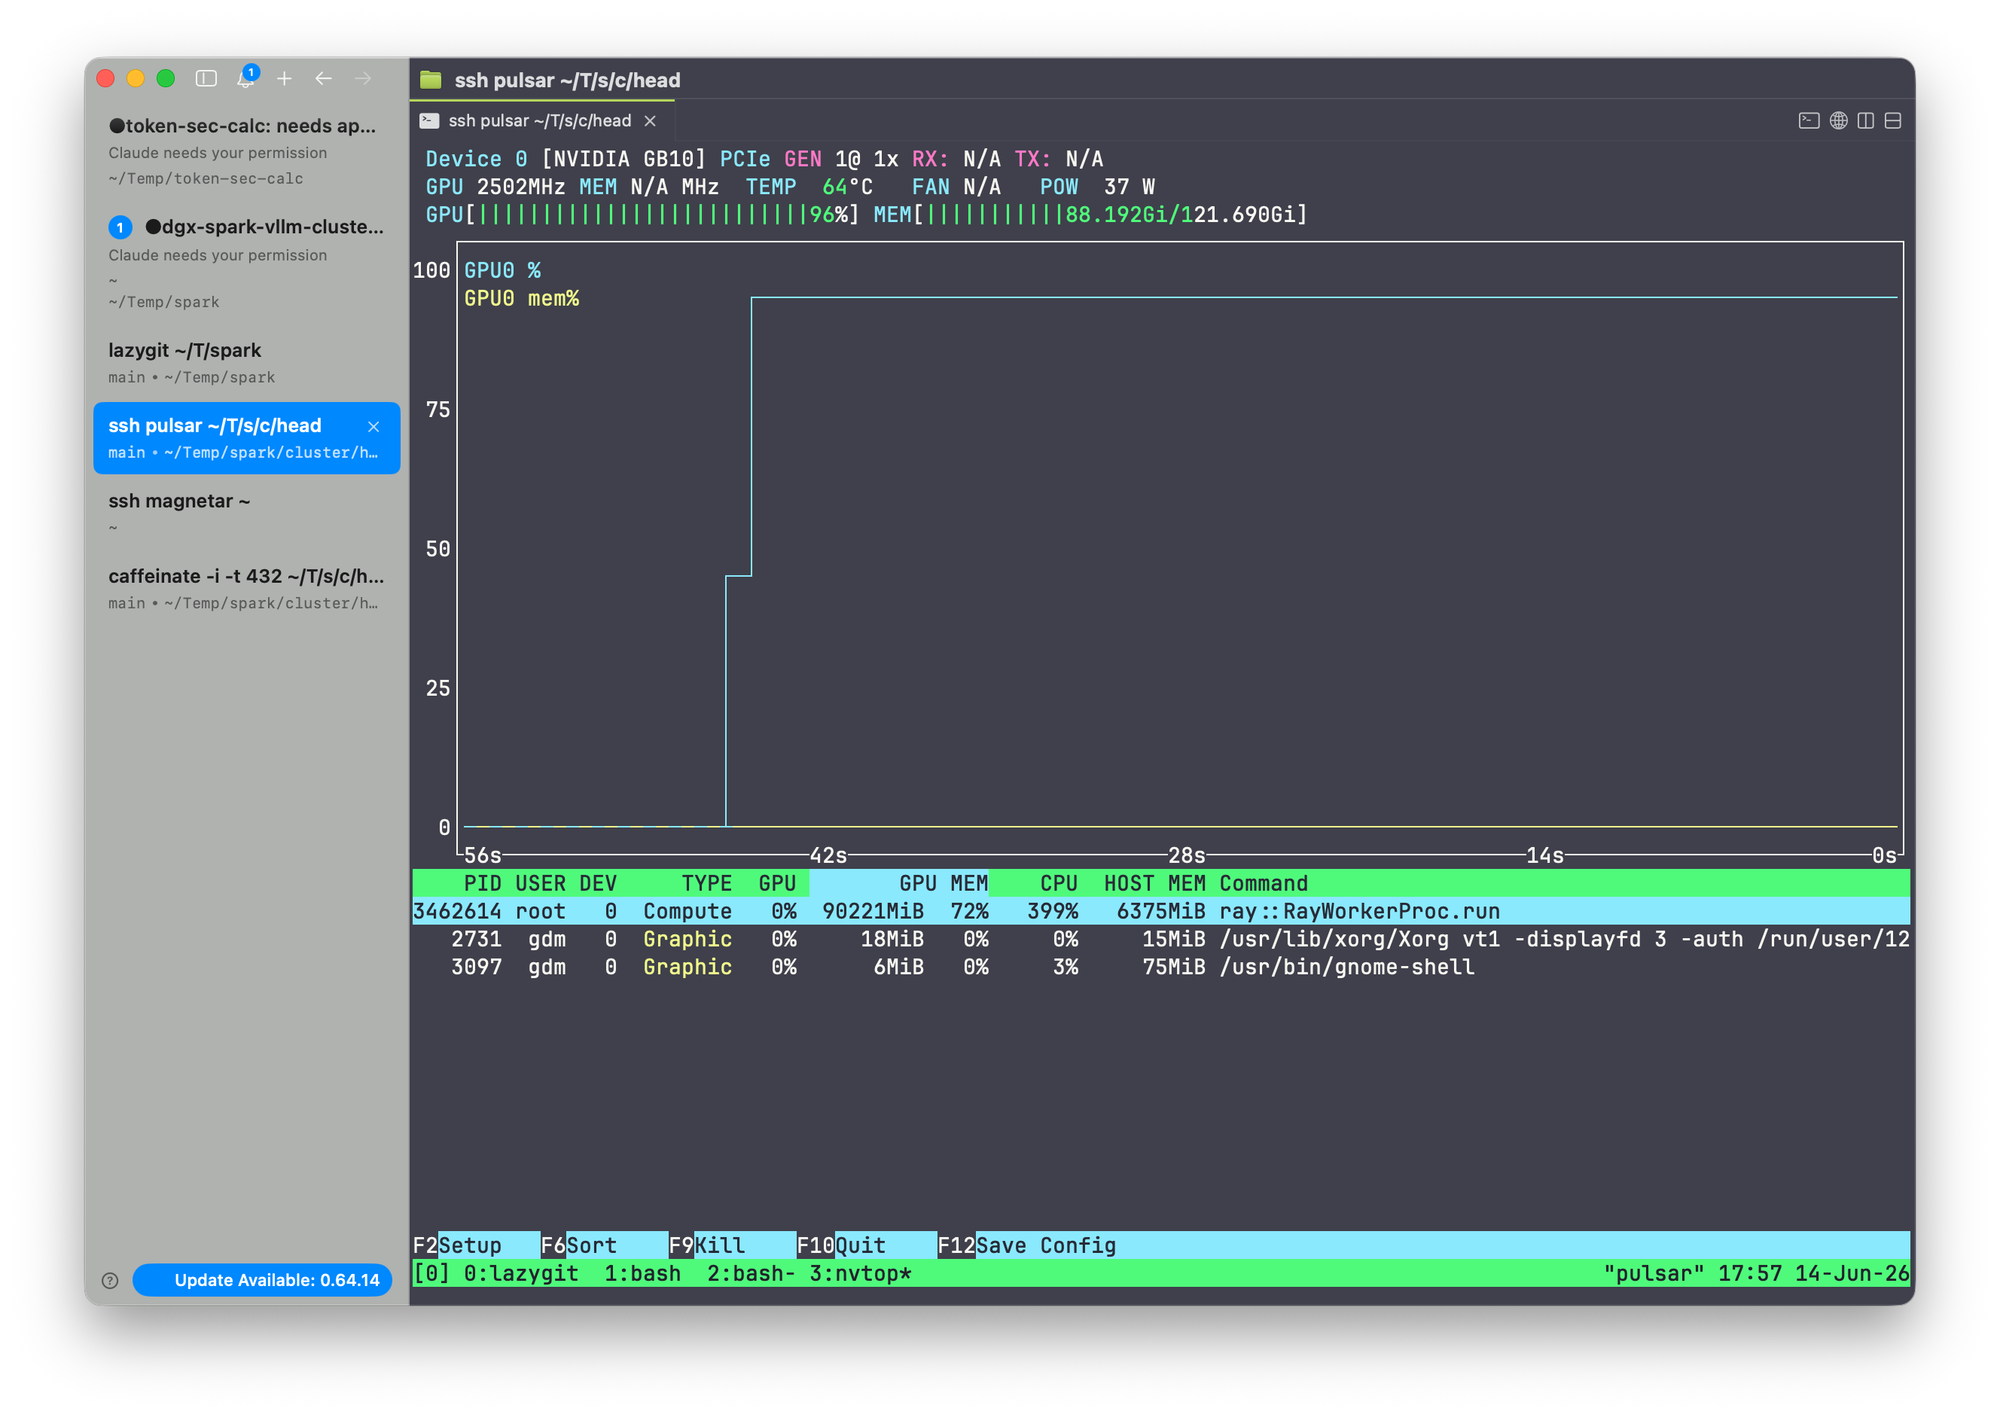
The numbers above are the client-side view. The server-side view, captured with nvtop on each DGX Spark node while the 64-concurrent benchmark was in flight, looks like this:
Node 1 (head node)
Node 2 (worker node)
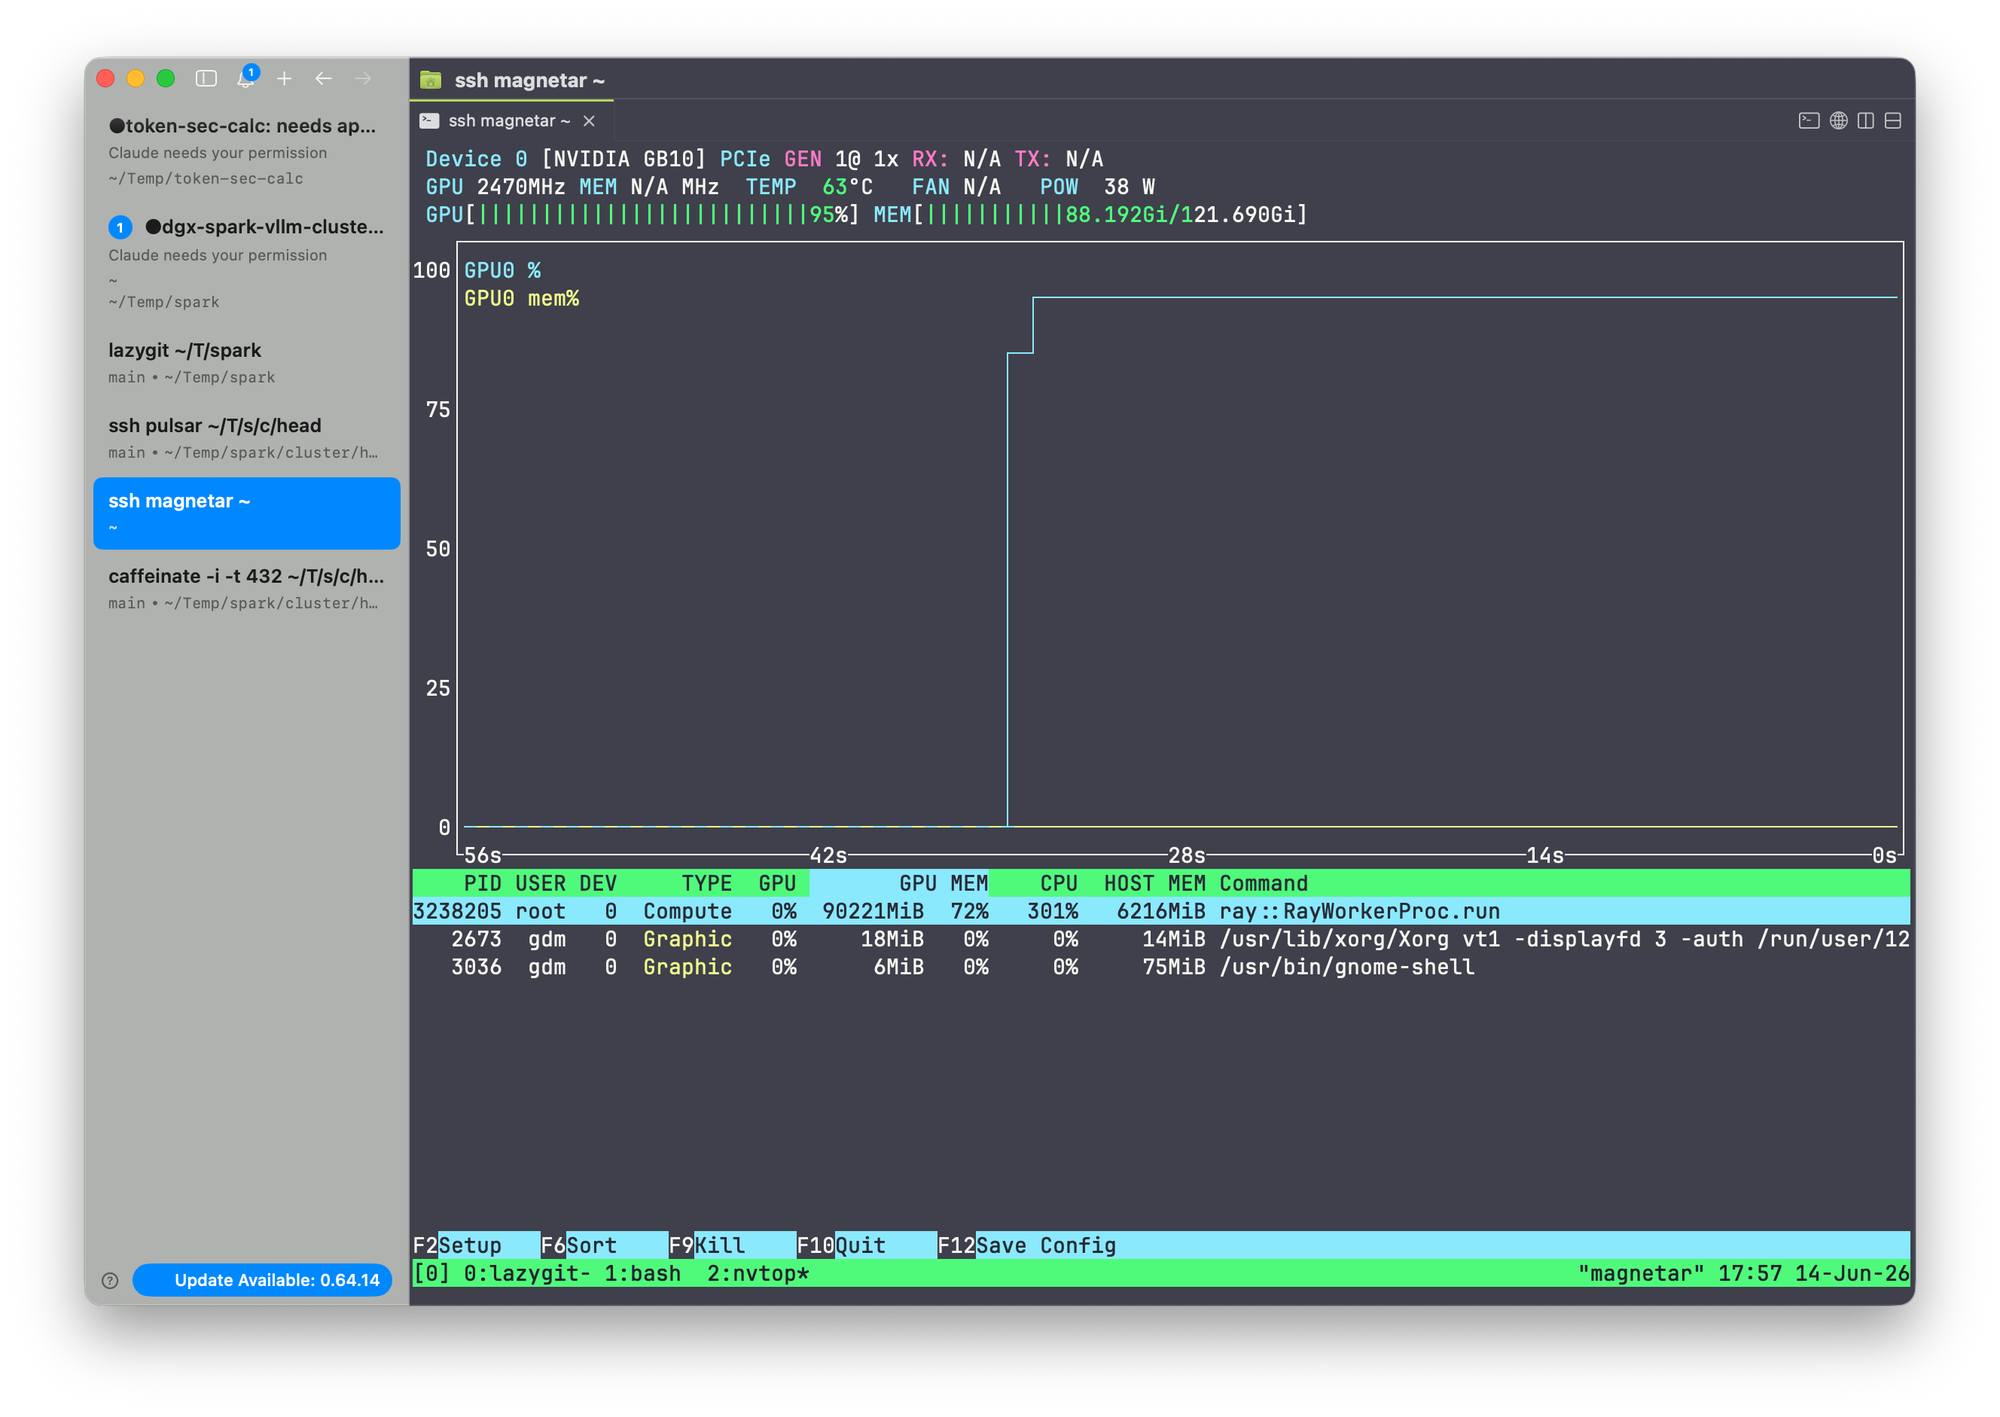
Both GB10 GPUs sit at 100% SM utilization with KV-cache memory fully resident for the duration of the run. This is the picture you want to see when you are trying to measure a model's serving ceiling: the bottleneck is on the accelerator, not on the network, the dispatcher, or the client.
A few things to read out of these screenshots in conjunction with the tool's output:
- Both nodes saturated, symmetric. Tensor-parallel sharding across the two-node cluster is balanced. If one node sat at 60% and the other at 100%, the slow node would be gating throughput and the aggregate
tok/snumber would have headroom that the benchmark could not reach. - Memory pressure, not compute headroom, is the cap. With 64 concurrent requests the KV-cache footprint dominates HBM. The reason adding more concurrency stops paying off is not idle SMs — it is KV-cache eviction and shrinking effective batch sizes.
- Power and thermal headroom is the next question. A sustained 100%-SM run on Blackwell will lean on the power envelope. For longer benchmark windows, watch the power and clock columns in
nvtopfor thermal throttling — a drop in clock that correlates with a drop in per-trialtok/sis the unmistakable signature.
Combined with the 2% p50→p99 latency spread, this is what a cleanly saturated serving stack looks like: the GPU is the limit, the batch scheduler is healthy, and the client-side number is a real measurement of the hardware's ceiling at this concurrency.
When to reach for it
token-sec-calc is the right tool when you need to:
- Compare two backends (vLLM build A vs build B, vLLM vs SGLang) under controlled inputs.
- Decide on a serving concurrency setting for a given model and SLO.
- Find the QPS at which TTFT or end-to-end latency falls off a cliff.
- Produce defensible numbers in a capacity-planning document.
It is the wrong tool when you need full-stack production load testing with distributed drivers, complex traffic shapes, retry logic, or correlated GPU-side telemetry. For those, this CLI is a useful primitive but not the whole answer.
Try it
git clone https://github.com/TechPreacher/token-sec-calc.git
cd token-sec-calc
uv sync --extra tiktoken
cp .env.example .env
# set ENDPOINT, API_KEY, MODEL
uv run benchmark --concurrent 4 --trials 5 --max_tokens 256 --stream true
If the numbers do not match what your serving dashboard says, that is exactly the point — now you have a clean second opinion.